


How worried should we be about household debt?
Canadian households carry a lot of debt, on average. How vulnerable are we to higher interest rates as an economic slow-down looms on the horizon?

Job numbers came out this week in both Canada and the US. In the good news = bad news situation that we’re in right now, strong labour market numbers mean that central banks are probably going to increase interest rates again later this month. It makes sense to ask what impact this higher cost of borrowing will have on Canadian households.
The Toronto Star pointed out that bankruptcies in November 2022 were at their highest point since the pandemic began, but we know everything has been unusual for the past couple of years, so I wanted to see what the longer term trend has been.

Data available from the Office of the Superintendent of Bankruptcy in Canada shows that the number of consumer insolvencies fell dramatically at the beginning of the pandemic, and continued to be relatively low through 2021. This is likely because of the pandemic supports that were available for workers.
The month-to-month data is pretty noisy so I’ve included a 12 month moving average to give a better picture of the trend. Total insolvencies (meaning both bankruptcies and formal proposals to restructure debt) are about 20% below their pre-pandemic average, but looking like it will catch up quickly. Recent changes probably say more about the removal of pandemic supports than about the impact of interest rates. That could change in the months to come, especially if unemployment increases.
Another indicator that we commonly hear about in the news is the debt-to-disposable income ratio. Canada’s has gone up pretty consistently since the 90’s, pandemic excepted. (I included the data for the US and UK here just to show that this ratio *can* go down.)

The ratio had been fairly stable in the 3 years leading up to the pandemic and then had a noticeable decline through 2020. As of the 2nd quarter of 2022 we hit a new record high of 185 - meaning the average household has $1.85 of debt for every dollar of disposable income.
Two caveats to this scary sounding number:
Averages mask wide differences across the whole population, and make it difficult to see emerging vulnerabilities.
Comparing total debt with disposable income is a bit like comparing apples and oranges. Debt is a stock (the current measure of an amount that you’ve accumulated over time), and income is a flow (an amount you’ve received during a specific time period). We don’t pay down the whole stock of debt with our current flow of income, we spread it out over time.
Economists know these things, but we still think it’s a useful (if broad) indicator. Knowing these caveats help us better interpret this chart - it tells us that Canadian households carry a lot of debt, but not much about the impact of that debt on their wellbeing or on their financial risk.
One apples-to-apples indicator is the household debt service ratio - the ratio of total obligated payments to disposable income. (Obligated payments differ from actual payments - ex. the minimum monthly payment on a credit card is often a fraction of the total amount owing, and if they can people often pay more than the minimum in order to avoid high interest fees.) Increases in this ratio will signal that higher interest rates are squeezing household budgets - but again, it’s an average.
Another apples-to-apples indicator is the ratio of total household liabilities to assets. Just to illustrate my averages point from above, I’m sharing the ratio broken out into wealth quintiles (Statistics Canada sorts households by their net wealth and then splits them into five groups). It’s also available by income quintile, age, main source of income. The average household liability to asset ratio is 15.5%, which masks some pretty big differences underneath.
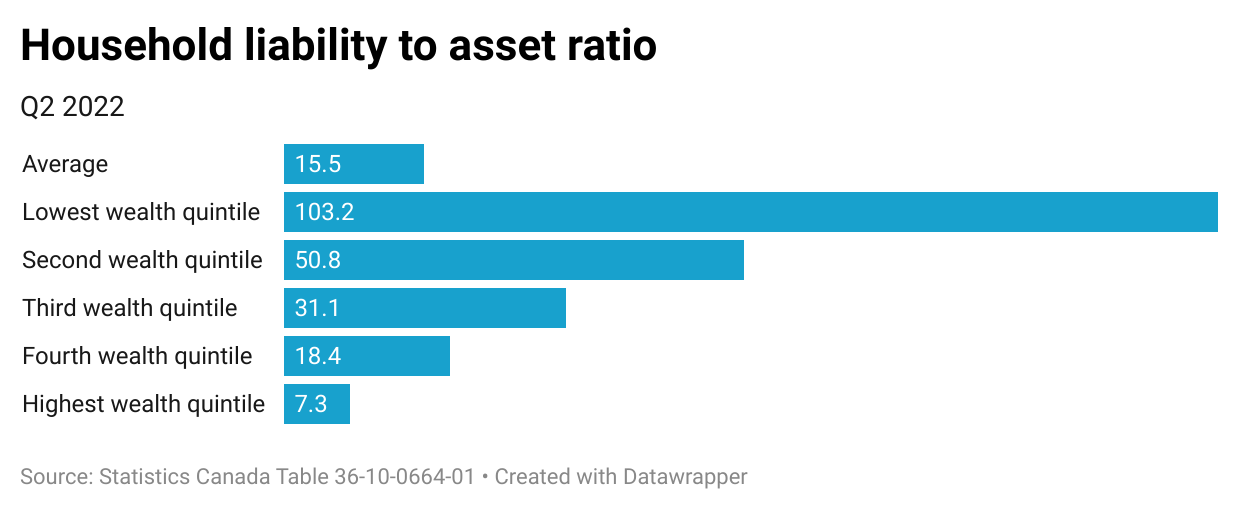
Those households with the least amount of wealth (i.e. the fewest assets), on average have slightly more debt than assets (103%). This group would include those who have more student debt than savings, or self-employed workers who have taken out loans.
A caveat here too, the bottom two quintiles only have 2.8% of the country’s total wealth, while the wealthiest 20% have two-thirds. So it’s not surprising that sorting by wealth would give us dramatic differences, but following the trend here for the lowest wealth quintile might give us some insight into growing vulnerabilities. Households with higher liability to asset ratios are more at risk when a recession hits.
Finally, if we want to see whether incomes are keeping up with inflationary pressures, we can look at net savings. The latest data from Statistics Canada is for the first half of 2022, and between Q1 and Q2 there was a big fall in average household net savings - from $2,272 in the first quarter to only $414 in the second quarter. Again, that average masks big differences between groups.

This is what it looks like when the cost of everything is going up faster than incomes. The average middle income quintile household moved from saving over $1,000 in Q1 to dis-saving over $1,000 in Q2.
This doesn’t necessarily mean that these households are borrowing to make up the difference, they could be dipping into previous savings, but either way, it’s going to mean an increase in their ‘liability to asset ratio’. In other words, it’s a sign of increasing vulnerability.
The answer: beaucoup d’uncertainty
Pandemic benefits made a big difference in keeping more households above water during 2020 and 2021. But those benefits have been phased out, and wages aren’t keeping pace with inflation. Disability benefits continue to fall against inflation in most provinces, and they were criminally low to begin with.
With the data that we have so far, it’s impossible to tell if we’re just returning to a pre-pandemic level, or if we’re heading into broader economic turmoil. The strong labour market is a good sign, if workers use the moment to fight for real wage increases. Provincial coffers are full, they should take the opportunity to improve disability benefits.
The big question, I think, is housing. We’re all less vulnerable to financial shocks if there are lots of decent affordable places to live. Governments at all levels have to figure their regulatory and public investment strategies out, sooner rather than later. (And if we could prioritize rapidly increasing the supply of not-for-profit, co-op and public housing, pretty please.)